Miroslav Renda
Senior Test Manager
Blog

Miroslav Renda
Senior Test Manager
Bottlenecks in systems or applications can slow performance, causing long load times and user frustration. In this article, we explore insights from Tesena’s performance testing experts, Tomáš Hák and Miroslav Renda, on identifying and resolving bottlenecks to ensure smooth system operations and a better user experience. We also cover common bottleneck sources, from CPU and memory issues to network constraints, and provide strategies for early detection and resolution through performance testing. Read on to discover how to keep your systems running efficiently and optimize performance to enhance user satisfaction.
In our exploration of performance testing (PT), we reached out to Tesena’s performance testing experts Tomáš Hák and Miroslav Renda to gather their insights on bottlenecks, and we’re excited to share their perspectives with you.
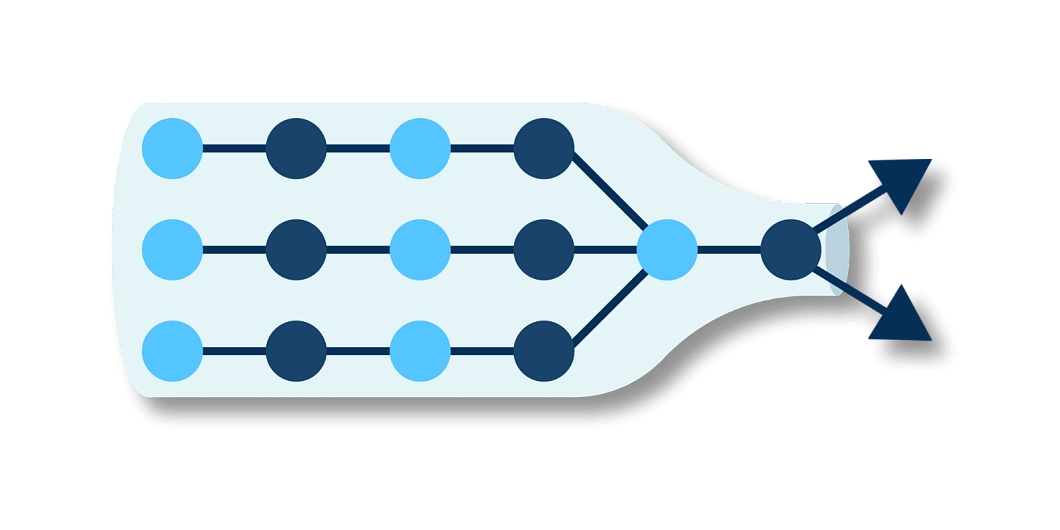
A bottleneck occurs when a single component or resource restricts the performance of a computer system or application. Whether the issue lies in software or hardware, this bottleneck can significantly slow down the overall process, much like the narrow neck of a bottle limits the flow of liquid. Bottlenecks can impact the entire system or just a specific function, leading to increased downtime, prolonged load times, and user frustration. Common examples include slow database queries, memory leaks, network congestion, or poorly optimized algorithms.

In today's world of quickly advancing technology, we understand that customer satisfaction depends on an application performing as expected or even better. User experience is crucial in nearly every industry, making it essential to address issues that could impact it. When an application doesn't perform well or has long load times, user experience suffers. This not only frustrates users but also negatively affects a website's SEO, making it harder to appear in search results. Bottlenecks are a major factor in these issues, preventing applications from running smoothly.

Common symptoms of bottlenecks include system downtime, slow response times, long load times, and software failures. When encountering an application bottleneck, you might wonder: 'Is there a code error? Is the issue related to the CPU, network, or memory usage?' The potential causes of performance slow-downs are numerous, and pinpointing bottlenecks becomes increasingly challenging as software complexity grows. Performance testing is essential for identifying the root cause of bottlenecks, helping to uncover the issue and get your application running efficiently. Testing traffic loads is crucial for analyzing how an application performs under different conditions. The first step in resolving a bottleneck is collecting data and formulating a strategy to optimize speed and overall performance.

Bottlenecks are system obstructions that degrade performance, often resulting from hardware issues, poor architecture, or coding errors. These issues cause a reduction in throughput under varying loads. Common performance bottlenecks include:
Resolving bottlenecks requires collaboration between performance testers, developers, architects, administrators, and other stakeholders. Depending on the bottleneck's nature, solutions may involve tuning, optimizing, upgrading, scaling, or redesigning system components. For instance, you might optimize database queries, increase memory allocation, add servers, or refactor code. It's essential to verify the effectiveness of these optimizations by re-running performance tests and comparing the results.
It's better to prevent bottlenecks than to resolve them, saving time, money, and effort. To achieve this, conduct performance testing early and frequently in the development lifecycle. Define realistic and measurable performance goals, design with performance in mind, adhere to coding standards for optimization, and utilize testing tools that support bottleneck analysis. Regularly review and update your performance testing strategy and plan to ensure ongoing efficiency.
In complex software systems, bottlenecks can be difficult to pinpoint, even for seasoned engineers. Profiling tools can greatly simplify the process of identifying these performance issues. While performance testing is a proactive approach to detect bottlenecks and other issues, profiling is a reactive technique that fine-tunes the performance testing process.
When performance tests reveal a problem in your system, locating the source of the slowdown is crucial. This can be particularly challenging in modern applications with extensive codebases and multiple components. Profilers assist by showing which parts of a program consume the most time and resources, analyzing function calls, time conditions, and memory usage. Before jumping into optimization, use a profiling tool like Prefix or Scalene to diagnose the issue accurately.
“Rushing to optimize before the bottlenecks are known may be the only error to have ruined more designs than feature creep.”
Eric S. Raymond
Performance bottlenecks are critical issues that can significantly impact the efficiency and user experience of software systems. Identifying and addressing these bottlenecks through comprehensive performance testing is essential for ensuring optimal system performance. By understanding the common types of bottlenecks, teams can implement targeted optimizations to improve system throughput and reliability. Regular testing and proactive optimization are key strategies in preventing performance issues before they escalate into major problems.
Don't miss out on the latest updates.
Fill in your email address to stay informed about upcoming training sessions, events, and testing know-how.
Need Advice?
Request our free, non-sales consultation. Fill out the form and we will get back to you.
Watchdog
Did not find a date that works for you? ....
Notice